 ZigBeeForDomoticZ plugin Wiki
The Web interface - Tools section
Please refer to STEP 3 Plugin Configuration to get access to the Web interface administration.
The Tools page has five tabs:
- Data — look at the plugin’s data, download it, and build a support bundle
- Command — send commands to a device
- Binding / Reporting — bind clusters, and set how attributes report (zigpy coordinators only)
- Debug — choose which parts of the plugin write debug messages
- Errors — the errors recorded by the plugin
Plugin 9.1.009 and later. This page describes the Tools page available since plugin 9.1.009. In older versions, Tools is a drop-down menu with the pages Tools, Command, Reporting, Binding, Debug and Error(s): the data is shown with one button per item and Export, binding is done by choosing a cluster then a source and a target, the debug modules are shown with Advanced settings and saved with Validate, and the errors are shown with Log Error History (json).
Tools in the menu bar opens the Data tab. The Errors tab carries a red dot while the plugin has errors you have not read.
Data
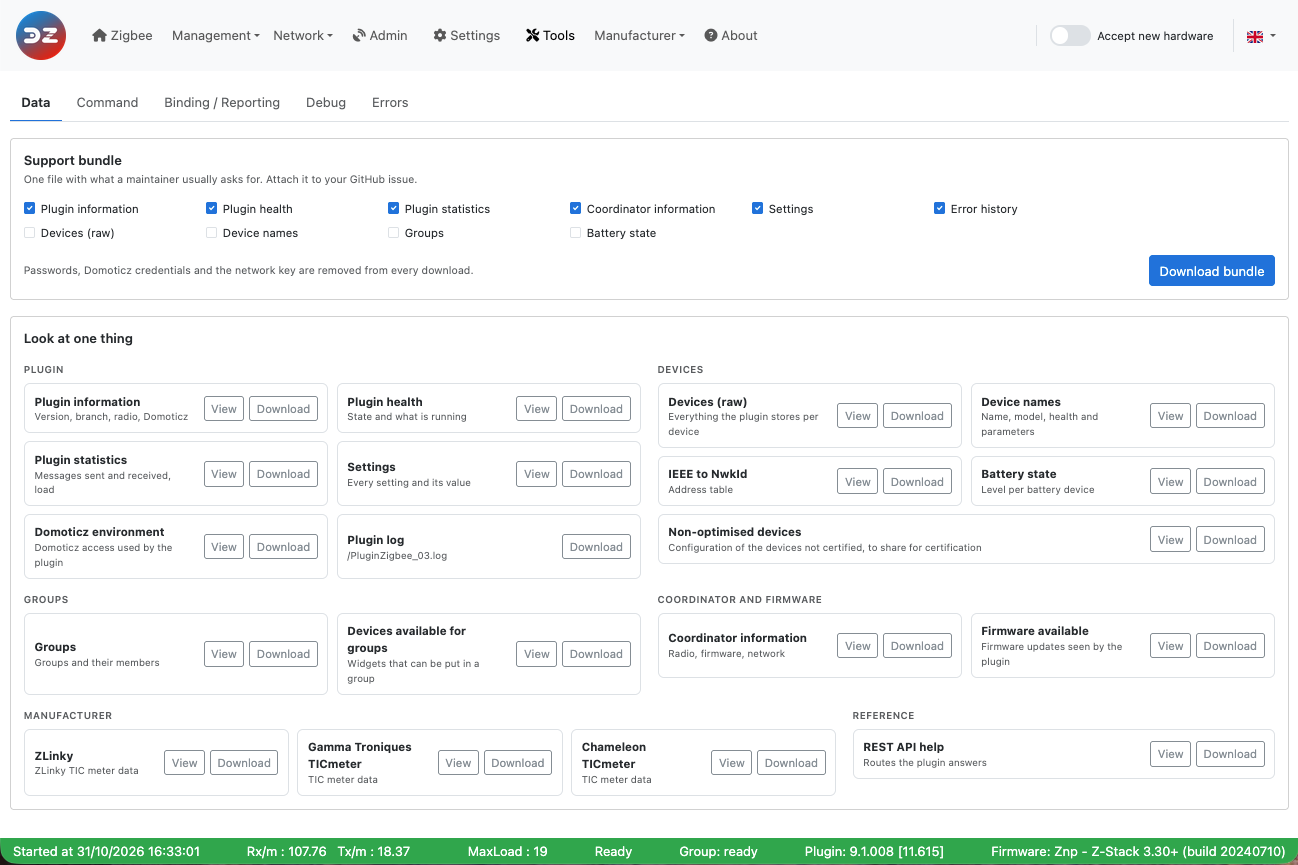
The Data tab (Tools > Data) shows what the plugin holds in memory, as JSON. It is mainly for troubleshooting and for developers.
 This picture may have changed since this documentation was written.
Support bundle
One file with what a maintainer usually asks for: attach it to your GitHub issue. Tick what to put in it, then click Download bundle. Plugin information, Plugin health, Plugin statistics, Coordinator information, Settings and Error history are ticked by default; Devices (raw), Device names, Groups and Battery state can be added. The file is named z4d-support-<date>-<time>.json.
Passwords, the Domoticz credentials and the network key are removed from the bundle, and from every download and copy of this tab. Including the Error history marks the errors as read, as opening the Errors tab does.
Look at one thing
Every item has two buttons:
- View opens the item in a viewer on the right of the page, with the REST route it comes from and the time it was read. Copy copies it to the clipboard, Download saves it, Refresh reads it again. Drag the line on the left of the viewer to make it wider (double-click it to go back to the default width); the browser remembers the width.
- Download saves the item as
z4d-<item>.json.
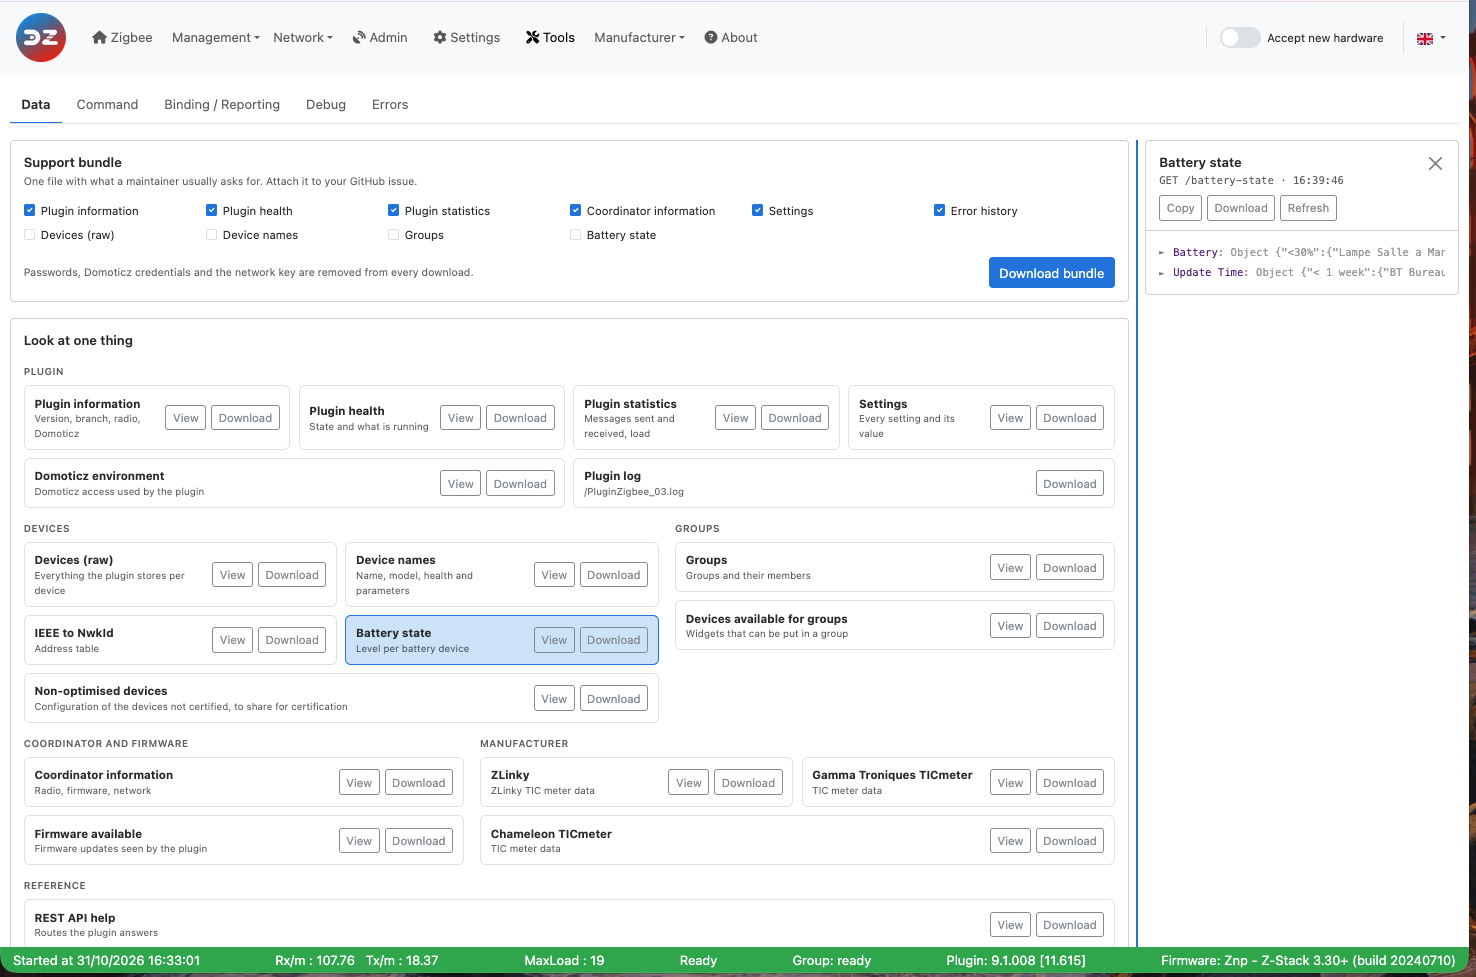
The items are grouped by what they cover: Plugin, Devices, Groups, Coordinator and firmware, Manufacturer and Reference. The Plugin log item downloads the current plugin log file; it is only there when the plugin writes its own log file (enablePluginLogging).
Refer to Use the plugin tools for what each item returns.
Command
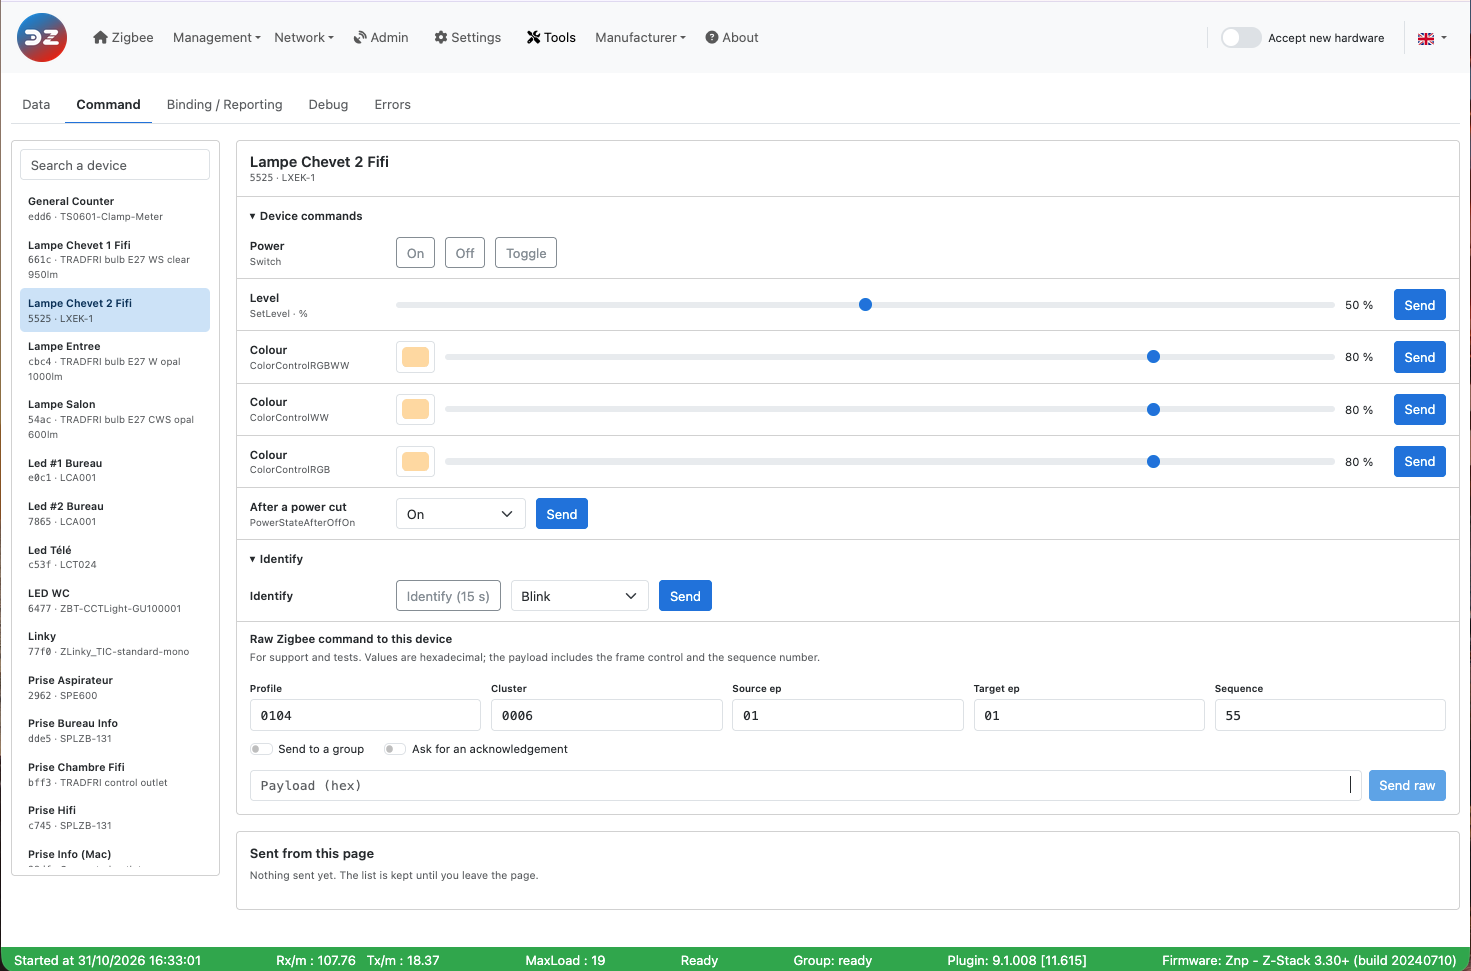
The Command tab (Tools > Command) sends commands to a device directly from the WebUI, without going through Domoticz.
 This picture may have changed since this documentation was written.
Choose the device in the list on the left (search by name, NwkId or model). The routers come first; end devices are marked end device, may be asleep, as a sleeping device only gets the command when it wakes up.
Device commands
The plugin offers the commands that match the widgets of the device, one row per widget type (the type is written under the row name):
- Power: On, Off, Toggle;
- Level: a slider, then Send;
- Cover and Cover position: Open, Close, Stop, and a position slider;
- Set point: a temperature, then Send;
- Colour: a colour and a brightness, then Send;
- After a power cut: the state the device takes when the power comes back (Off, On, Toggle, Previous state).
Identify makes the device show itself: Identify (15 s), or an effect (Blink, Breathe, Okay, Channel change, Finish the effect, Stop the effect) then Send.
Device commands and Identify can be folded; the browser remembers which ones are folded. When the plugin offers no command for the device, the page says so: the raw Zigbee command below still works.
Raw Zigbee command
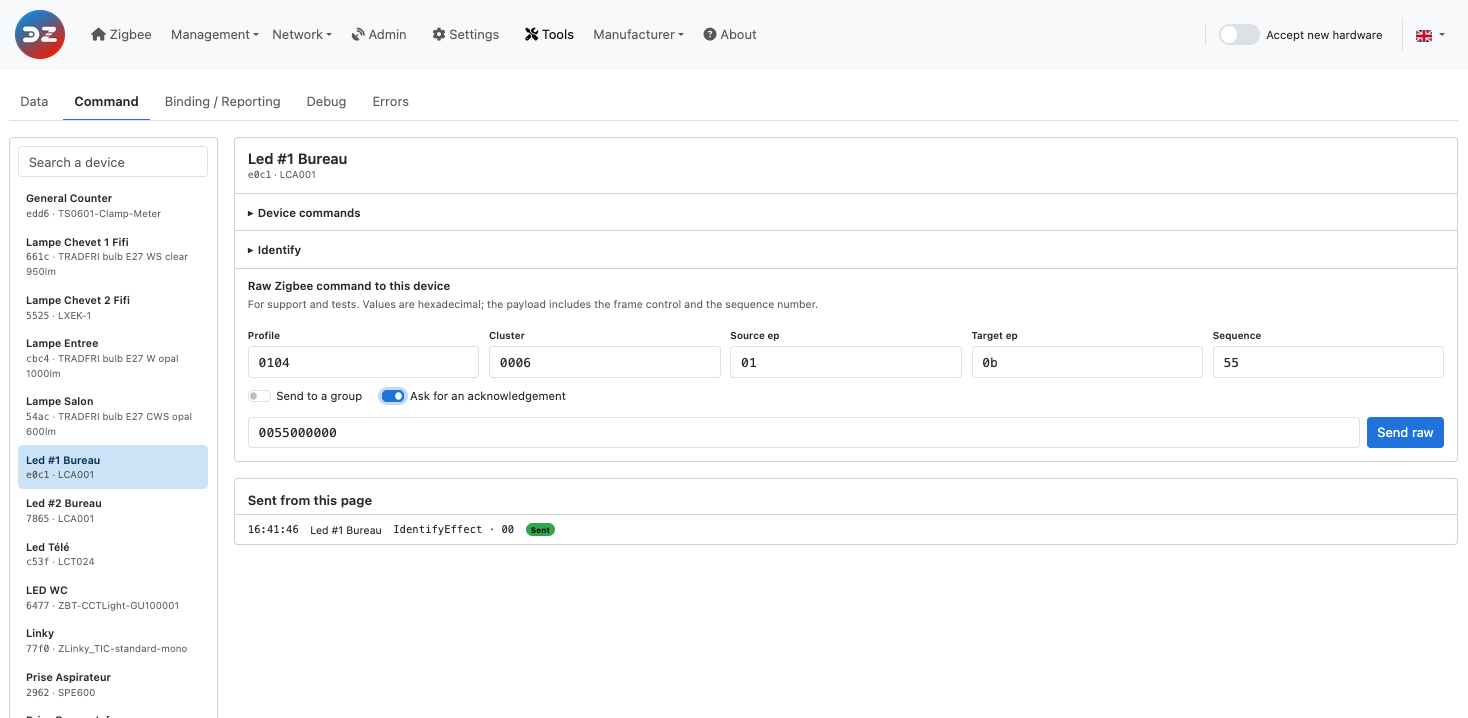
With a zigpy coordinator (ZNP, EZSP/Bellows, deCONZ, BLZ), Raw Zigbee command to this device sends a raw Zigbee frame to the device chosen on the left. It is meant for advanced users who know the Zigbee Cluster Library (ZCL): the plugin does not check or build anything, and sends the payload exactly as typed.
 This picture may have changed since this documentation was written.
All values are hexadecimal, without 0x.
Field
What to enter
Profile
0104 (Home Automation) for ZCL commands, 0000 for ZDO/ZDP requests.
Cluster
The cluster, for example 0000 (Basic), 0006 (On/Off), 0008 (Level Control).
Source ep
The coordinator’s endpoint, usually 01 (00 for ZDO/ZDP).
Target ep
The device endpoint that holds the cluster (00 for ZDO/ZDP). It is filled with the first endpoint of the device.
Sequence
The sequence number of the request, for example 55. Use the same value as the sequence number inside the payload.
Send to a group
Sends the frame as a group (multicast) request, to the Group id you enter, instead of the device.
Ask for an acknowledgement
Asks the device for an APS acknowledgement.
Payload (hex)
The complete ZCL frame, header included (see below).
Click Send raw. The WebUI only confirms that the command was sent; it does not show the device’s answer. The plugin processes the answer like any other message from the device, so look at the plugin log to follow it.
Building the payload
The payload is the complete ZCL frame, written as one string of hexadecimal bytes:
Bytes
Content
1
Frame control: 00 for a general (profile-wide) command such as Read Attributes, 01 for a command specific to the cluster. Add 04 for a manufacturer-specific command (04 or 05).
2
Manufacturer code, only for a manufacturer-specific command.
1
Transaction sequence number, the same as Sequence.
1
Command identifier, for example 00 Read Attributes, 02 Write Attributes.
n
The command’s fields.
Endianness: Zigbee sends every value longer than one byte in little-endian order, least significant byte first. You must reverse the bytes yourself in the payload: attribute 0x0005 is typed 0500, the manufacturer code 0x115F is typed 5F11, and a 16-bit value 0x012C is typed 2C01.
This only applies to the payload. The other fields (Profile, Cluster, Sequence…) are typed the normal way, as in the picture: 0104, 0006.
The payload of the picture, 0055000000, sent to the cluster 0006, reads the OnOff attribute of the light:
Bytes
Meaning
00Frame control: general command, from client to server
55Transaction sequence number (same as Sequence)
00Command Read Attributes
0000Attribute 0x0000 (OnOff), little-endian
More examples:
Goal
Cluster
Payload
Read the Model Identifier (attribute 0x0005)
00000055000500
Read the Manufacturer Name and Model Identifier (attributes 0x0004 and 0x0005)
000000550004000500
Switch on
0006015501
Switch off
0006015500
Toggle
0006015502
With a ZiGate coordinator this part is replaced by ZiGate command (raw), below the device, which sends a raw command to the ZiGate following the ZiGate protocol.
Sent from this page
Every command sent from the tab is listed with its time, the device, what was sent and Sent (or Error when the plugin refused it). The list is kept until you leave the page.
Binding / Reporting
The Binding / Reporting tab (Tools > Binding / Reporting) shows, for one device, what each of its clusters is bound to and, with a zigpy coordinator, how its attributes report.
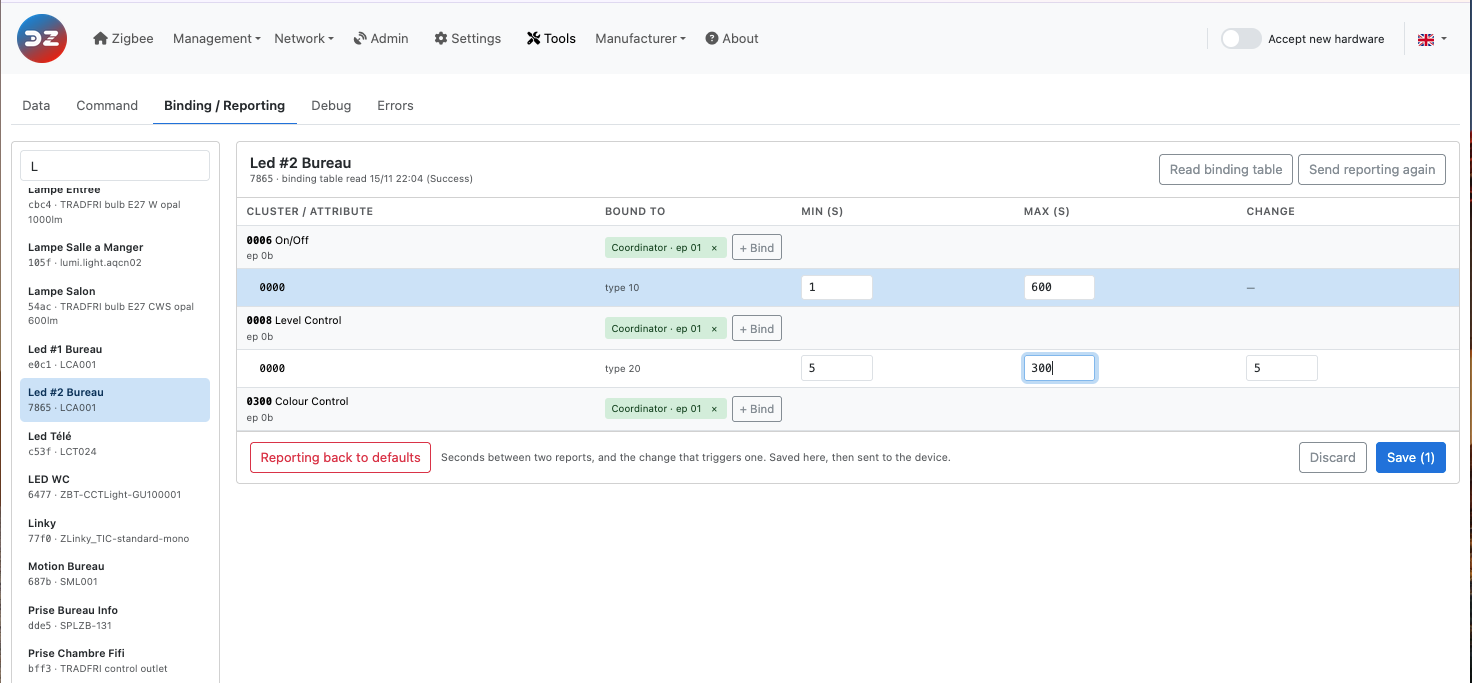 This picture may have changed since this documentation was written.
Choose the device in the list on the left. The table has one row per endpoint and cluster that can be bound (plus any cluster that has a binding or a reporting configuration), with the endpoint under the cluster name.
Binding
A binding makes the device send its commands or reports for one cluster directly to another device, without going through the coordinator. The Bound to column shows the targets found in the device’s binding table: another device, the Coordinator, or a group.
- Read binding table asks the device for its binding table; it shows a few seconds later, when the device answers. The date of the last read is shown under the device name.
- + Bind on a cluster row, then choose the target (the devices that have this cluster, with their endpoint) and click Bind.
- The × of a target unbinds it.
A battery device sleeps: wake it up (press one of its buttons) just before you read its table or bind it, so that it receives the request.
Refer to the tutorial Bind two devices for more information.
Reporting
With a zigpy coordinator, each reported attribute has its own row under its cluster, with its data type and three values: Min (s) and Max (s), in seconds, and Change (the minimum change that triggers a report, only for values that are numbers). The device sends a report when the value has changed by at least Change, but not more often than every Min, and at least every Max even if nothing changed.
- Change the values, then Save (N) stores them in the plugin for this device. Discard drops your changes.
- Send reporting again sends the reporting configuration to the device now.
- Reporting back to defaults drops the values of this device: it goes back to the plugin’s default configuration.
With a ZiGate coordinator, only the binding part is shown.
Debug
The Debug tab (Tools > Debug) chooses which parts (modules) of the plugin write debug messages, for which devices, and how the log files are kept.
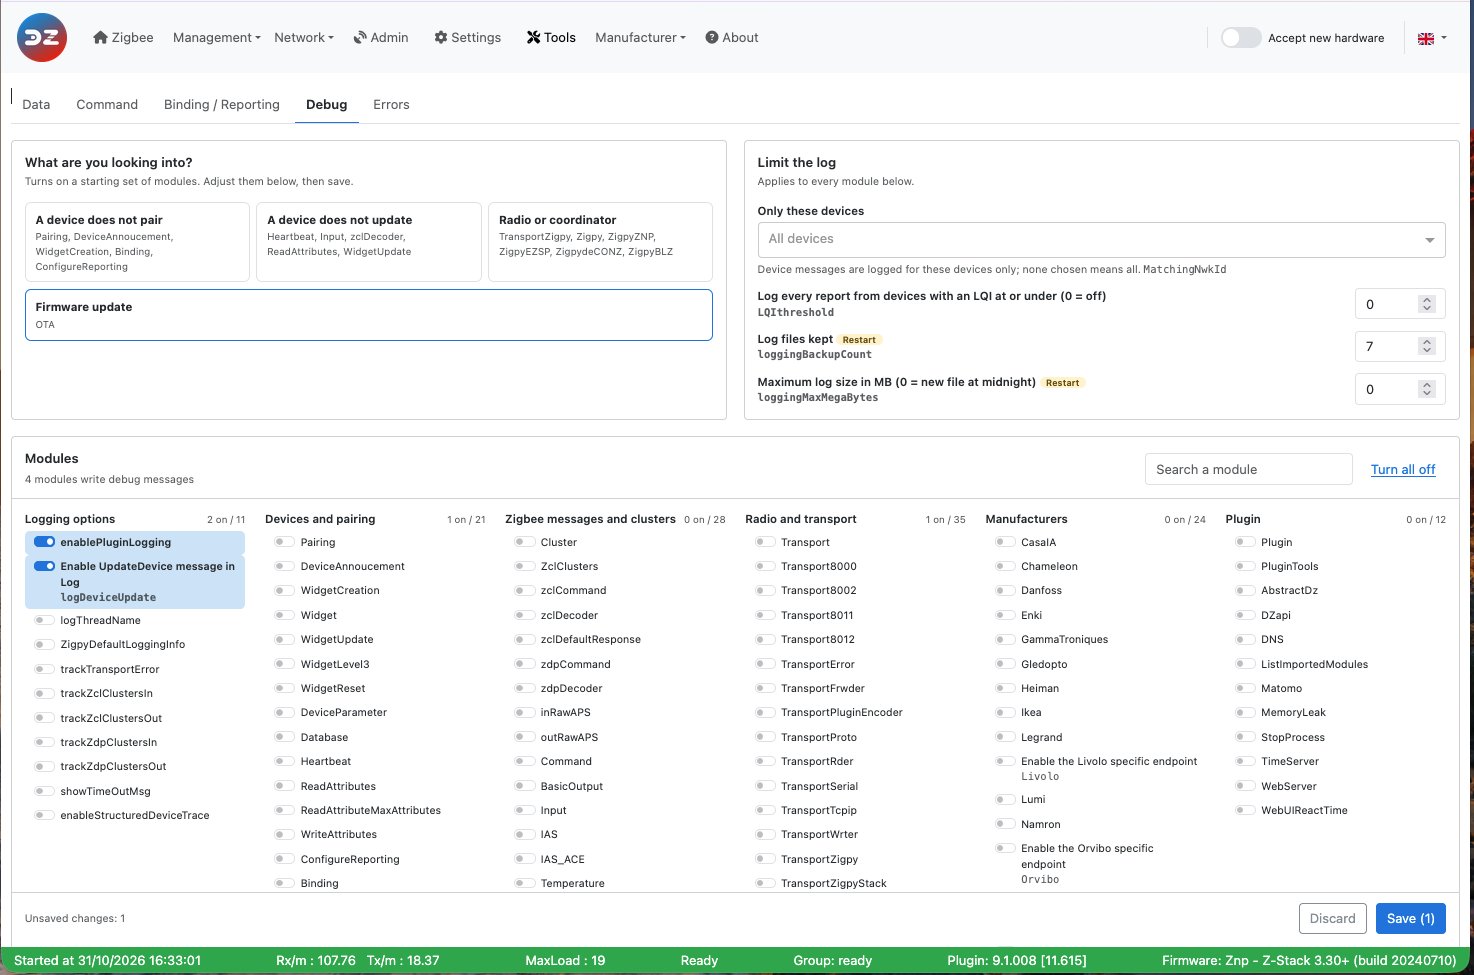 This picture may have changed since this documentation was written.
- What are you looking into? Each card turns on a starting set of modules for a type of problem: A device does not pair, A device does not update, Radio or coordinator, Firmware update. Adjust the modules below, then save.
- Limit the log: applies to every module.
- Only these devices (
MatchingNwkId): device messages are only logged for the devices you choose; none chosen means all devices.
LQIthreshold: logs every report from the devices with an LQI at or under this value (0 turns it off).loggingBackupCount, the number of log files kept, and loggingMaxMegaBytes, the maximum size of a log file (0 = a new file every night). Both need a plugin restart.
- Modules: the switches, grouped as Logging options, Devices and pairing, Zigbee messages and clusters, Radio and transport, Manufacturers, Plugin, and Zigpy libraries (the
Python/… loggers of zigpy and its radio libraries). Each group shows how many of its modules are on. Search a module filters them; Turn all off switches every module off.
The changes are counted at the bottom (Unsaved changes). Save (N) sends them to the plugin, Discard drops them. The modules take effect immediately; when a change needs a restart, the WebUI says so and the Restart needed indicator appears.
Refer to Debugging mode for what each module does, and which ones to enable for a given problem.
Errors
The Errors tab (Tools > Errors) lists the errors recorded by the plugin. It is also where the Error(s) detected indicator of the menu bar (blinking red triangle) leads. Opening the tab marks the errors as read: the red triangle and the red dot of the tab go away until a new error is recorded.
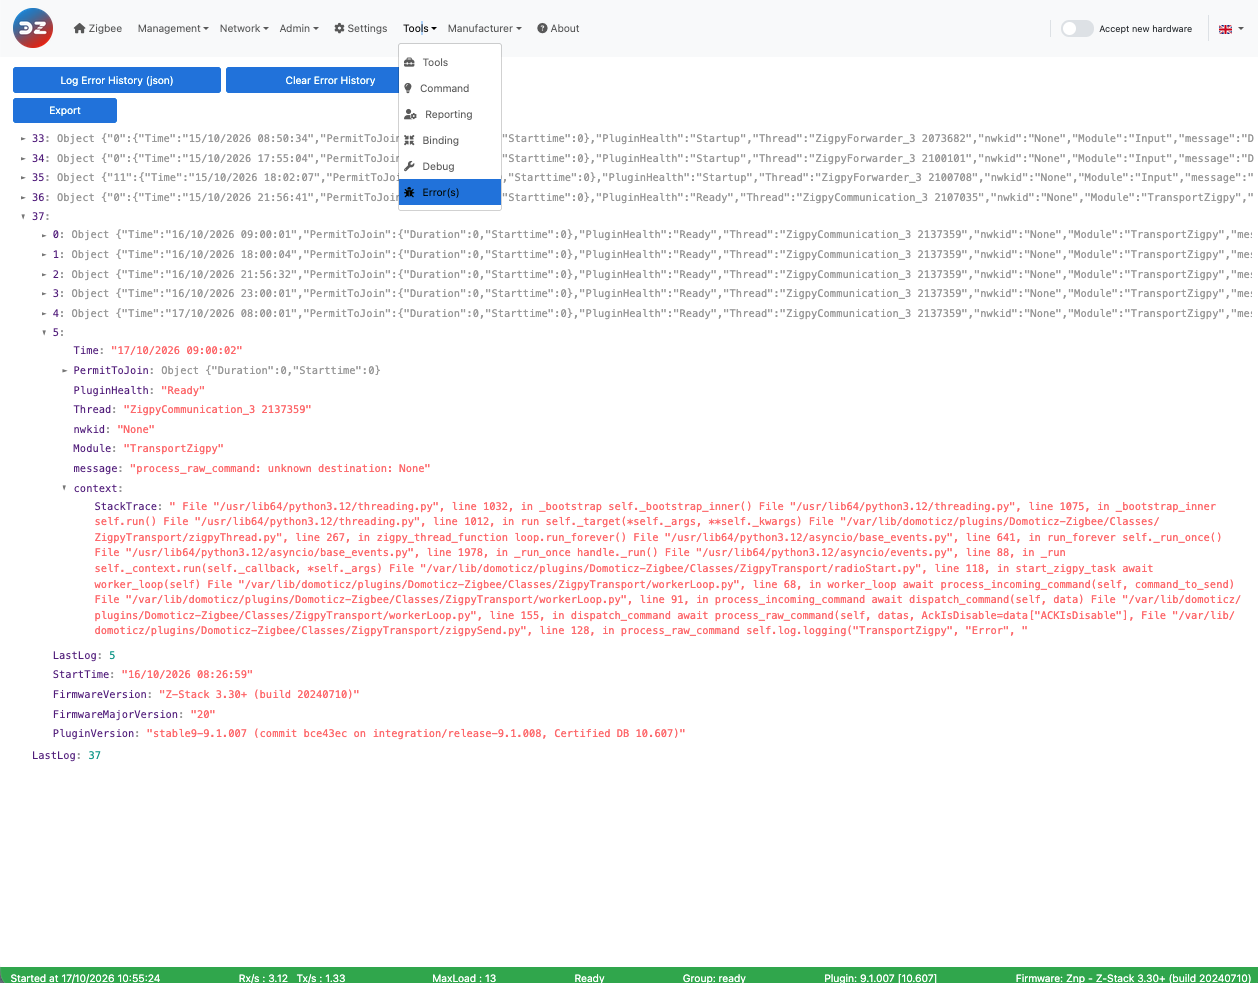 This picture may have changed since this documentation was written.
On the left, the errors are grouped by plugin start, newest first, with the plugin version of that start. Each error shows its time, its module, its error code if any, the message and the device. Search message, device or error code and the module list filter them.
Click an error to see its details: the message, the time, the module and the thread; the device (NwkId, name, model); the plugin at that time (health, whether pairing was open, plugin version, coordinator firmware); and the context the plugin recorded. Copy as GitHub issue text copies all this, ready to paste in an issue.
- Refresh reads the history again.
- Download .json saves the whole history as
z4d-errors.json, for example to attach to an issue.
- Clear history… empties the history, after a confirmation. This cannot be undone: download it first if you need it.
Refer to the tutorial Deal with plugin errors for more information.
Look at the other pages of the plugin Web interface.
The Web interface - Tools section
Please refer to STEP 3 Plugin Configuration to get access to the Web interface administration.
The Tools page has five tabs:
- Data — look at the plugin’s data, download it, and build a support bundle
- Command — send commands to a device
- Binding / Reporting — bind clusters, and set how attributes report (zigpy coordinators only)
- Debug — choose which parts of the plugin write debug messages
- Errors — the errors recorded by the plugin
Plugin 9.1.009 and later. This page describes the Tools page available since plugin 9.1.009. In older versions, Tools is a drop-down menu with the pages Tools, Command, Reporting, Binding, Debug and Error(s): the data is shown with one button per item and Export, binding is done by choosing a cluster then a source and a target, the debug modules are shown with Advanced settings and saved with Validate, and the errors are shown with Log Error History (json).
Tools in the menu bar opens the Data tab. The Errors tab carries a red dot while the plugin has errors you have not read.
Data
The Data tab (Tools > Data) shows what the plugin holds in memory, as JSON. It is mainly for troubleshooting and for developers.
This picture may have changed since this documentation was written.
Support bundle
One file with what a maintainer usually asks for: attach it to your GitHub issue. Tick what to put in it, then click Download bundle. Plugin information, Plugin health, Plugin statistics, Coordinator information, Settings and Error history are ticked by default; Devices (raw), Device names, Groups and Battery state can be added. The file is named z4d-support-<date>-<time>.json.
Passwords, the Domoticz credentials and the network key are removed from the bundle, and from every download and copy of this tab. Including the Error history marks the errors as read, as opening the Errors tab does.
Look at one thing
Every item has two buttons:
- View opens the item in a viewer on the right of the page, with the REST route it comes from and the time it was read. Copy copies it to the clipboard, Download saves it, Refresh reads it again. Drag the line on the left of the viewer to make it wider (double-click it to go back to the default width); the browser remembers the width.
- Download saves the item as
z4d-<item>.json.
The items are grouped by what they cover: Plugin, Devices, Groups, Coordinator and firmware, Manufacturer and Reference. The Plugin log item downloads the current plugin log file; it is only there when the plugin writes its own log file (enablePluginLogging).
Refer to Use the plugin tools for what each item returns.
Command
The Command tab (Tools > Command) sends commands to a device directly from the WebUI, without going through Domoticz.
This picture may have changed since this documentation was written.
Choose the device in the list on the left (search by name, NwkId or model). The routers come first; end devices are marked end device, may be asleep, as a sleeping device only gets the command when it wakes up.
Device commands
The plugin offers the commands that match the widgets of the device, one row per widget type (the type is written under the row name):
- Power: On, Off, Toggle;
- Level: a slider, then Send;
- Cover and Cover position: Open, Close, Stop, and a position slider;
- Set point: a temperature, then Send;
- Colour: a colour and a brightness, then Send;
- After a power cut: the state the device takes when the power comes back (Off, On, Toggle, Previous state).
Identify makes the device show itself: Identify (15 s), or an effect (Blink, Breathe, Okay, Channel change, Finish the effect, Stop the effect) then Send.
Device commands and Identify can be folded; the browser remembers which ones are folded. When the plugin offers no command for the device, the page says so: the raw Zigbee command below still works.
Raw Zigbee command
With a zigpy coordinator (ZNP, EZSP/Bellows, deCONZ, BLZ), Raw Zigbee command to this device sends a raw Zigbee frame to the device chosen on the left. It is meant for advanced users who know the Zigbee Cluster Library (ZCL): the plugin does not check or build anything, and sends the payload exactly as typed.
This picture may have changed since this documentation was written.
All values are hexadecimal, without 0x.
| Field | What to enter |
|---|---|
| Profile | 0104 (Home Automation) for ZCL commands, 0000 for ZDO/ZDP requests. |
| Cluster | The cluster, for example 0000 (Basic), 0006 (On/Off), 0008 (Level Control). |
| Source ep | The coordinator’s endpoint, usually 01 (00 for ZDO/ZDP). |
| Target ep | The device endpoint that holds the cluster (00 for ZDO/ZDP). It is filled with the first endpoint of the device. |
| Sequence | The sequence number of the request, for example 55. Use the same value as the sequence number inside the payload. |
| Send to a group | Sends the frame as a group (multicast) request, to the Group id you enter, instead of the device. |
| Ask for an acknowledgement | Asks the device for an APS acknowledgement. |
| Payload (hex) | The complete ZCL frame, header included (see below). |
Click Send raw. The WebUI only confirms that the command was sent; it does not show the device’s answer. The plugin processes the answer like any other message from the device, so look at the plugin log to follow it.
Building the payload
The payload is the complete ZCL frame, written as one string of hexadecimal bytes:
| Bytes | Content |
|---|---|
| 1 | Frame control: 00 for a general (profile-wide) command such as Read Attributes, 01 for a command specific to the cluster. Add 04 for a manufacturer-specific command (04 or 05). |
| 2 | Manufacturer code, only for a manufacturer-specific command. |
| 1 | Transaction sequence number, the same as Sequence. |
| 1 | Command identifier, for example 00 Read Attributes, 02 Write Attributes. |
| n | The command’s fields. |
Endianness: Zigbee sends every value longer than one byte in little-endian order, least significant byte first. You must reverse the bytes yourself in the payload: attribute
0x0005is typed0500, the manufacturer code0x115Fis typed5F11, and a 16-bit value0x012Cis typed2C01.This only applies to the payload. The other fields (Profile, Cluster, Sequence…) are typed the normal way, as in the picture:
0104,0006.
The payload of the picture, 0055000000, sent to the cluster 0006, reads the OnOff attribute of the light:
| Bytes | Meaning |
|---|---|
00 |
Frame control: general command, from client to server |
55 |
Transaction sequence number (same as Sequence) |
00 |
Command Read Attributes |
0000 |
Attribute 0x0000 (OnOff), little-endian |
More examples:
| Goal | Cluster | Payload |
|---|---|---|
Read the Model Identifier (attribute 0x0005) |
0000 |
0055000500 |
Read the Manufacturer Name and Model Identifier (attributes 0x0004 and 0x0005) |
0000 |
00550004000500 |
| Switch on | 0006 |
015501 |
| Switch off | 0006 |
015500 |
| Toggle | 0006 |
015502 |
With a ZiGate coordinator this part is replaced by ZiGate command (raw), below the device, which sends a raw command to the ZiGate following the ZiGate protocol.
Sent from this page
Every command sent from the tab is listed with its time, the device, what was sent and Sent (or Error when the plugin refused it). The list is kept until you leave the page.
Binding / Reporting
The Binding / Reporting tab (Tools > Binding / Reporting) shows, for one device, what each of its clusters is bound to and, with a zigpy coordinator, how its attributes report.
This picture may have changed since this documentation was written.
Choose the device in the list on the left. The table has one row per endpoint and cluster that can be bound (plus any cluster that has a binding or a reporting configuration), with the endpoint under the cluster name.
Binding
A binding makes the device send its commands or reports for one cluster directly to another device, without going through the coordinator. The Bound to column shows the targets found in the device’s binding table: another device, the Coordinator, or a group.
- Read binding table asks the device for its binding table; it shows a few seconds later, when the device answers. The date of the last read is shown under the device name.
- + Bind on a cluster row, then choose the target (the devices that have this cluster, with their endpoint) and click Bind.
- The × of a target unbinds it.
A battery device sleeps: wake it up (press one of its buttons) just before you read its table or bind it, so that it receives the request.
Refer to the tutorial Bind two devices for more information.
Reporting
With a zigpy coordinator, each reported attribute has its own row under its cluster, with its data type and three values: Min (s) and Max (s), in seconds, and Change (the minimum change that triggers a report, only for values that are numbers). The device sends a report when the value has changed by at least Change, but not more often than every Min, and at least every Max even if nothing changed.
- Change the values, then Save (N) stores them in the plugin for this device. Discard drops your changes.
- Send reporting again sends the reporting configuration to the device now.
- Reporting back to defaults drops the values of this device: it goes back to the plugin’s default configuration.
With a ZiGate coordinator, only the binding part is shown.
Debug
The Debug tab (Tools > Debug) chooses which parts (modules) of the plugin write debug messages, for which devices, and how the log files are kept.
This picture may have changed since this documentation was written.
- What are you looking into? Each card turns on a starting set of modules for a type of problem: A device does not pair, A device does not update, Radio or coordinator, Firmware update. Adjust the modules below, then save.
- Limit the log: applies to every module.
- Only these devices (
MatchingNwkId): device messages are only logged for the devices you choose; none chosen means all devices. LQIthreshold: logs every report from the devices with an LQI at or under this value (0 turns it off).loggingBackupCount, the number of log files kept, andloggingMaxMegaBytes, the maximum size of a log file (0 = a new file every night). Both need a plugin restart.
- Only these devices (
- Modules: the switches, grouped as Logging options, Devices and pairing, Zigbee messages and clusters, Radio and transport, Manufacturers, Plugin, and Zigpy libraries (the
Python/…loggers of zigpy and its radio libraries). Each group shows how many of its modules are on. Search a module filters them; Turn all off switches every module off.
The changes are counted at the bottom (Unsaved changes). Save (N) sends them to the plugin, Discard drops them. The modules take effect immediately; when a change needs a restart, the WebUI says so and the Restart needed indicator appears.
Refer to Debugging mode for what each module does, and which ones to enable for a given problem.
Errors
The Errors tab (Tools > Errors) lists the errors recorded by the plugin. It is also where the Error(s) detected indicator of the menu bar (blinking red triangle) leads. Opening the tab marks the errors as read: the red triangle and the red dot of the tab go away until a new error is recorded.
This picture may have changed since this documentation was written.
On the left, the errors are grouped by plugin start, newest first, with the plugin version of that start. Each error shows its time, its module, its error code if any, the message and the device. Search message, device or error code and the module list filter them.
Click an error to see its details: the message, the time, the module and the thread; the device (NwkId, name, model); the plugin at that time (health, whether pairing was open, plugin version, coordinator firmware); and the context the plugin recorded. Copy as GitHub issue text copies all this, ready to paste in an issue.
- Refresh reads the history again.
- Download .json saves the whole history as
z4d-errors.json, for example to attach to an issue. - Clear history… empties the history, after a confirmation. This cannot be undone: download it first if you need it.
Refer to the tutorial Deal with plugin errors for more information.
Look at the other pages of the plugin Web interface.